Top Answer:It could be even more automated. For instance, the moment you deploy something, the monitoring can be there for everything. You will just have to launch or click the console in the morning, and then… more »
Cloud Logging is a fully managed service that performs at scale and can ingest application and platform log data, as well as custom log data from GKE environments, VMs, and other services inside and outside of Google Cloud. Get advanced performance, troubleshooting, security, and business insights with Log Analytics, integrating the power of BigQuery into Cloud Logging.
Built-in metrics observability at scale
Cloud Monitoring provides visibility into the performance, uptime, and overall health of cloud-powered applications. Collect metrics, events, and metadata from Google Cloud services, hosted uptime probes, application instrumentation, and a variety of common application components. Visualize this data on charts and dashboards and create alerts so you are notified when metrics are outside of expected ranges.
Stand-alone managed service for running and scaling Prometheus
Managed Service for Prometheus is a fully managed Prometheus-compatible monitoring solution, built on top of the same globally scalable data store as Cloud Monitoring. Keep your existing visualization, analysis, and alerting services, as this data can be queried with PromQL or Cloud Monitoring.
Monitor and improve your application's performance
Application Performance Management (APM) combines the monitoring and troubleshooting capabilities of Cloud Logging and Cloud Monitoring with Cloud Trace and Cloud Profiler to help you reduce latency and cost so you can run more efficient applications.
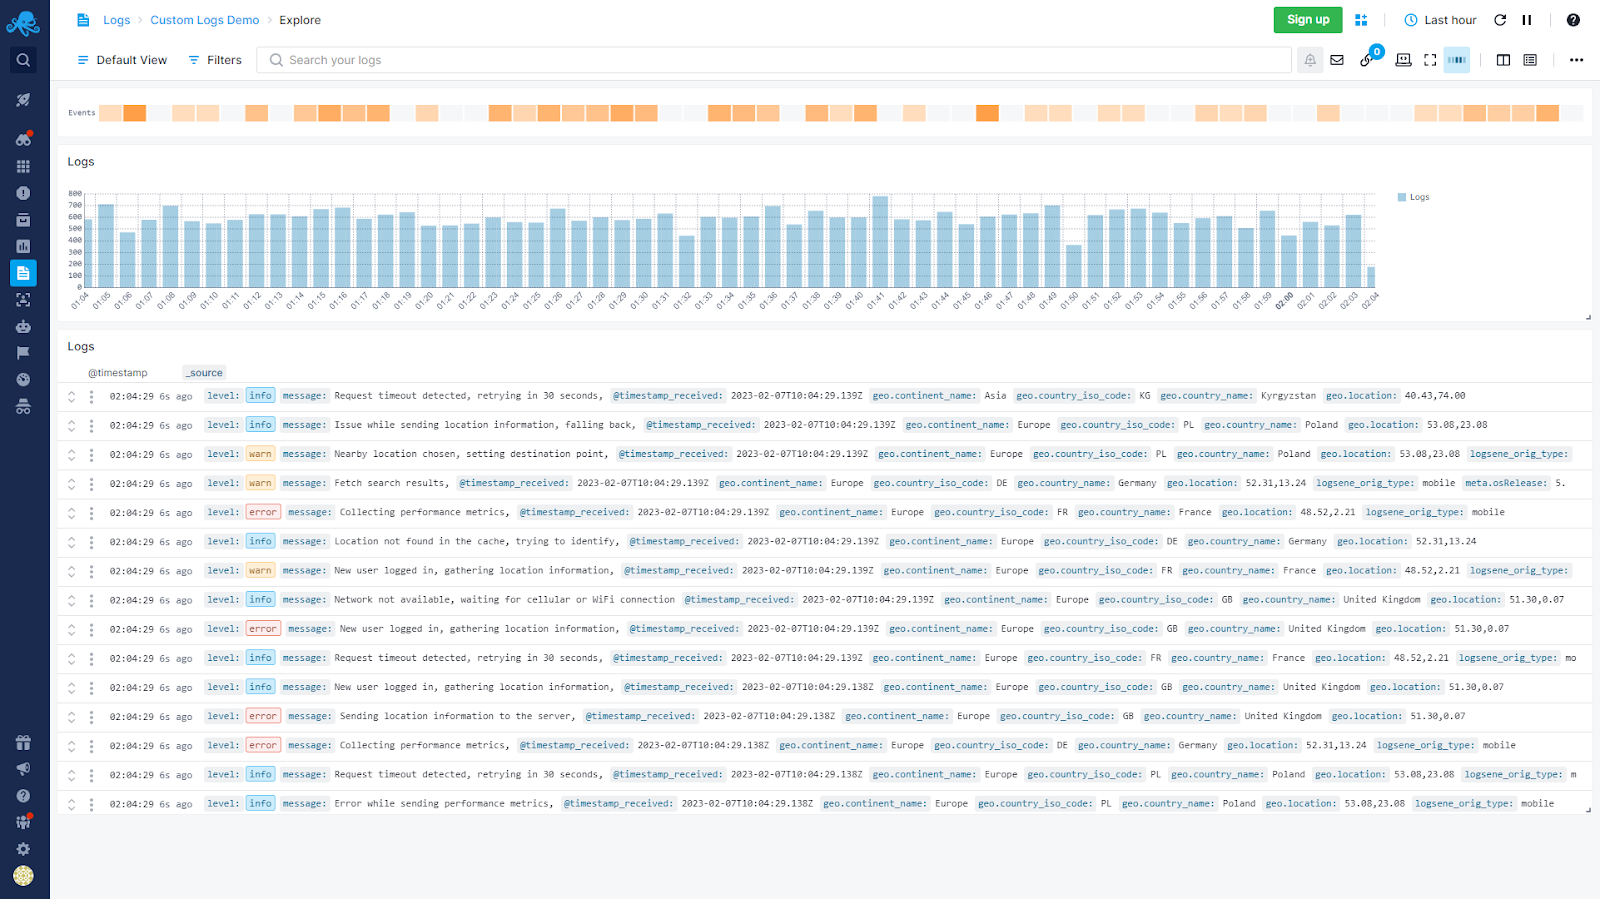
Sematext Logs is a cloud-based SaaS log management solution that offers you real-time actionable insights into your log analytics with hosted ELK as a service, in the cloud or on-premises. Logs can be aggregated from a variety of sources using it because it's compatible with a large number of log shippers, libraries, platforms, and frameworks. Sematext’s auto-discovery of logs and services lets you automatically start log monitoring from both log files and containers and forward them directly through the user interface. Sematext Logs features sophisticated full-text searching, filtering, and tagging capabilities and allows you to correlate logs with infrastructure and application metrics within a single dashboard.
Sematext Logs Benefits
Centralized logging With Sematext Logs, you can store and aggregate logs from all your data sources, including servers, infrastructure, apps, databases, containers, and systems, in a central location.
Hosted ELK as a service Using Sematext Logs, you will benefit from an Elasticsearch API and Kibana in the cloud without having to manage the infrastructure or pay for expensive consultants. Select a log shipper that works for you - Logstash, Filebeat, rsyslog, Logagent, etc. Analyze logs, and correlate them with infrastructure and application metrics.
Alerting on Logs Embrace the simplicity and ease of troubleshooting with our metric and log alerts, so you can concentrate on such matters as working on other projects or getting other work done. Sematext analyzes logs for optimal health when detecting anomalies, so you don't have to worry about those things.
Log security Utilize a centralized log management service to maintain security and compliance for cloud-native applications. AWS runs Sematext Logs, whose infrastructure follows IT security best practices and adheres to a variety of compliance standards such as SOC 1/SSAE, SOC 2, SOC 3,16/ISAE 3402 (formerly SAS 70 Type II), FISMA, DIACAP, FedRAMP, and HIPAA.
Powerful Searching and Filtering Using fast and intuitive search tools, you can search, filter, and analyze log data to identify and fix issues before they affect your business and prevent them from getting worse.
Saved Searches & Log Taggings Rerun recent and saved searches without typing them again. Save any query as Saved Search or Alert Query. Run Live Tail for any Saved Search. Autocomplete recent and saved searches. Tag Saved Searches with custom labels and colors. See log charts for Saved Searches at a glance, without running them.
100+ integrations Use any of the compatible log shippers, logging libraries, platforms, and frameworks to make the most out of your logs. Supports all standard logging facilities and agents, ships logs via Syslog, ship from apps via Log4j, Logback, Log4j 2, Log4net, Winston, Python SyslogHandler... Supports Java, PHP, Perl, GoLang, Python, .NET, Ruby, and JavaScript. Ship with anything that can talk to Elasticsearch or Syslog.
Just some of the things you can do with Sematext Logs
Integration with other Sematext Cloud components, such as Infrastructure Monitoring, Synthetics, and Experience. For example, you can have dashboards with widgets from any component, so you can see which error caused that CPU spike
Spike-friendly pricing. Ingestion is averaged out and calculated on top of the “base” plan. For example, if you have the cheapest paid plan ($50/month, supports 1GB/day) and send 60GB in a month (2GB per day, on average), you end up paying $100
Configurable overage – you can choose when Sematext stops accepting logs, to control your cost
Per-silo pricing. You can create multiple “apps”, for example, Production and QA. Each can have its own plan (volume, retention) and overage configuration
Agent-free: any log shipper or library that works with syslog or Elasticsearch will work with Sematext Logs
Elasticsearch API access beyond indexing: you can run searches, export data, create custom templates, and more
Extra features on top of the ELK stack are available, such as role-based access control, alerting, and anomaly detection
Where to go from here?
Sign up for a free trial and try it for yourself. We offer both free and paid plans. Our commercial plan starts at $50 per GB per day for 7-day retention and you can try it free for 14 days. The free plan includes 500 MB per day.
768,578 professionals have used our research since 2012.
Google Cloud's operations suite (formerly Stackdriver) is ranked 27th in Log Management with 9 reviews while Sematext Logs is ranked 59th in Log Management. Google Cloud's operations suite (formerly Stackdriver) is rated 7.8, while Sematext Logs is rated 0.0. The top reviewer of Google Cloud's operations suite (formerly Stackdriver) writes "Good logging and tracing but does need more profiling capabilities". On the other hand, Google Cloud's operations suite (formerly Stackdriver) is most compared with AWS X-Ray, Datadog, Azure Monitor, Amazon CloudWatch and Grafana, whereas Sematext Logs is most compared with Graylog, Grafana Loki and Logsign Next-Gen SIEM.
We monitor all Log Management reviews to prevent fraudulent reviews and keep review quality high. We do not post
reviews by company employees or direct competitors. We validate each review for authenticity via cross-reference
with LinkedIn, and personal follow-up with the reviewer when necessary.